For many of us, we wait to see what is selling out of our Etsy stores and what sells best. This is a natural thing many of us do to measure if we are handling our businesses the right way. And when we see a bump in sales? Naturally, we must be on the right path.
But are we actually seeing things the way they are long –term? And what measurements can we consider in trying to get even more sales moving? Finding useful statistics in the decision-making process is essential when it comes to making strategic decisions, and these stats are available to you right now.
Finding actionable statistics might be more difficult than it sounds initially, and it can be hard to distinguish between helpful and useless data when looking at these stats. You have a lot of choices to choose as an Etsy business owner. Others are more long-term and like we said have to do with how to expand your store, how to work more effectively, and how to offer better customer service. Some decisions are related to the current day-to-day operations of your company. The second category of decisions should be referred to as strategic, long-term decisions for the future.
Identifying the Key Performance Indicators (KPIs) that could improve your decision-making is a great starting step. A KPI is a quantifiable value that shows how well your company is doing. Make careful to link your KPIs to your company’s goals and monitor them over time. Focus on a few goals and KPIs when choosing which to enhance, and consider how doing so will affect the rest of your organization. We advise integrating your Etsy account with Google Analytics to maximize the value of your Etsy statistics, and to only use those with real useable data.
Some Metrics to Consider

The following is a list of standard metrics that many Etsy shop owners use to plot their course of action over time. This is by no means the full list of what is out there for you, but these are the main ones and they will give you a great start into using this level of information the right way.
Visitors
Visitors count the number of customers who have come into your store. If there are no customers, there are no sales. The number of visits can be increased in a variety of ways, including SEO and internet marketing.
Pageviews
Pageviews track how many pages your shop’s visitors have seen in total. Each page a visitor views on your shop counts as another pageview. This will give you a good indication if people are indeed going deeper into your site or passing it by at first glance.
Traffic Generation 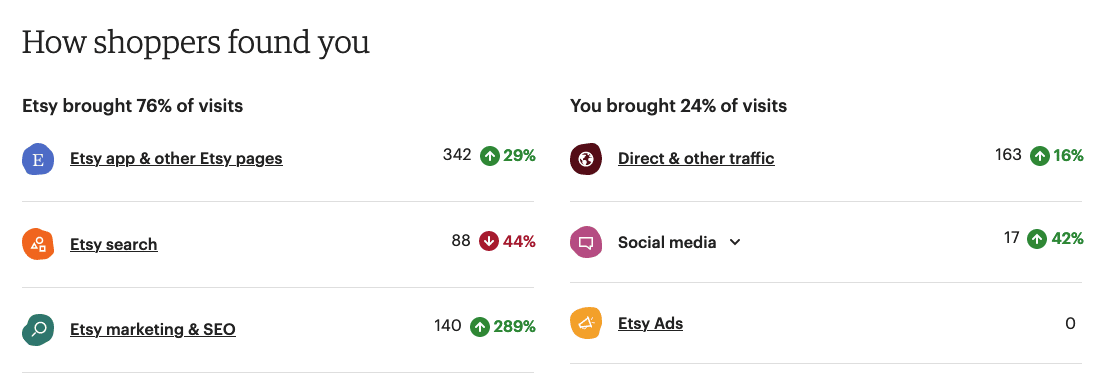
You may learn how customers find you by looking at the traffic sources for your store. The majority of traffic to most Etsy stores is generated by users who browse and search the marketplace. It can be dangerous to only rely on traffic from Etsy, so it is frequently a good idea to monitor the performance of other traffic sources, such as social media and other search engines like Google.
Typical divisions of traffic sources:
- Direct traffic refers to customers who type the URL into their browser, click a link in a text message or email, or open a bookmark to go straight to your store. This demonstrates the effectiveness of your email or text message marketing, and it may also indicate that your brand is well-known. Or, if it’s not as popular as you assumed. Either way, important numbers to know.
- Referring traffic is the term for customers who find your store through a link on another website. This group includes traffic coming from social media.
- Search engine traffic is the number of people who visit your store after clicking on a link on a search engine’s results page, such as Google, Bing, or Yahoo!
Conversion rate
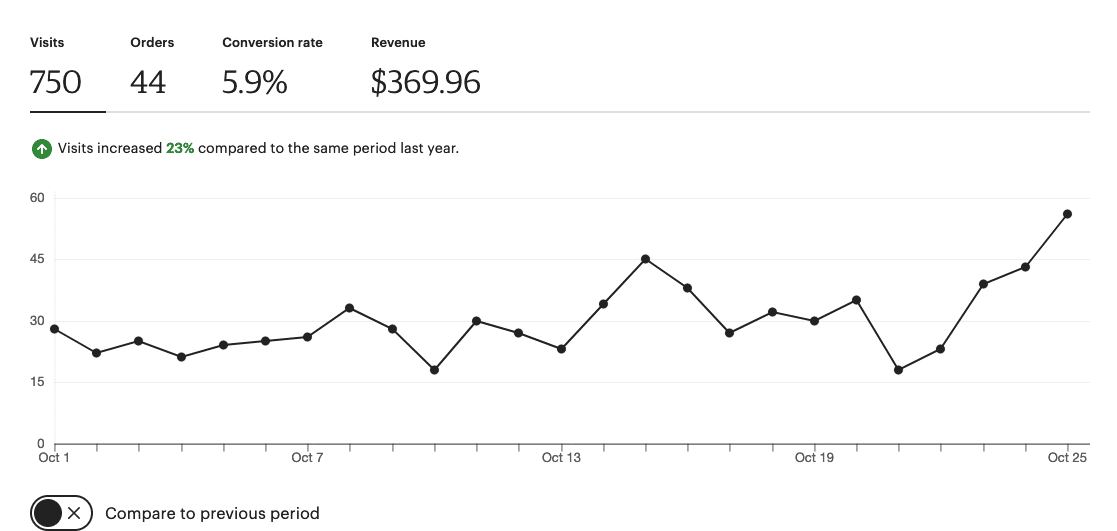
The percentage of visitors that make a purchase is measured by conversion rate (converting “Visitors” into “Customers”). There are various techniques to increase conversion rates; however, you must experiment to see which methods work best for you. Examples of things to take into account are your product descriptions, pricing, and photographs. Consider whether you are drawing the correct kind of visitors.
Session Length (Duration)
Session duration gauges how long on average visitors stay on your shop’s pages seeing products or other content before either leaving or making a purchase. Although the meaning of the session length is not always clear, in general you want to increase it because it shows that your visitors are interested in what you have to offer. Keeping track of how long visitors are spending in your store, on its surface, can also indicate that kind of overall experience visitors are having when they choose to go to your store regardless of product.
Tied to this, the percentage of visitors who leave your store after only viewing one item or page is known as the “bounce rate.” Although it can be challenging to examine this KPI, you want it to be as low as possible because it shows that your visitors are actively browsing your store. In general, increasing the attraction of your shop will lower your bounce rate.
You can also measure stats related to other things, such as the orders themselves. By using these metrics, you can calculate the average revenue each order brings in. You can boost your prices or come up with new items and services for your clients to increase your average income per order. Or collect date on how many different items customers purchase on average per overall sale.
Keeping an Eye on Profits
But one of the most important things to get a proper read on is your overall profitability, and what it’s actually costing you in time and materials to produce the things you sell. Your financial health is a vital thing to constantly monitor and comes down to two basic concepts, which you can get easy and clear stats on:
Overall Gross Margins:
Because it is so straightforward, this KPI, which measures your shop’s financial efficiency, is quite effective. It will be difficult to pay for additional expenses that are not directly related to production when your gross margin is low. When creating new products for your store, we strongly advise you to figure out your gross margin.
Cost of Goods Sold (COGS)
The price of the materials and labor used directly to make your product is included in the cost of sold goods (COGS). Time and labor are often overlooked and must be realistically factored in; for example, if you work five hours to make something that you sell for $50 and cost you $25 in raw materials, you value your labor at $5 an hour. You have to determine if you feel this is “profitable” for you, but it’s good to have such facts on hand. Please note that shipping and distribution-related costs, such as taxes and Etsy fees, are excluded from COGS, as they are variables depending on location and ever-changing service surcharges.
